Saturday 28 July 2018

Steady-State VS Transient Propeller Numerical Simulation Comparison

     This post is about the comparison between steady-state and transient computational fluid dynamics analysis of two different propellers. The propellers under investigation are 11x7 and 11x4.7 propellers. The first number in the propeller nomenclature is the propeller diameter and the second number represents the propeller pitch, both parameters are in inch. The transient analysis was carried out using the sliding mesh technique while the steady-state results were obtained by the local rotating region-averaging method. For details about 11x7 propeller click here, for the details about 11x4.7 propeller, click here.
 
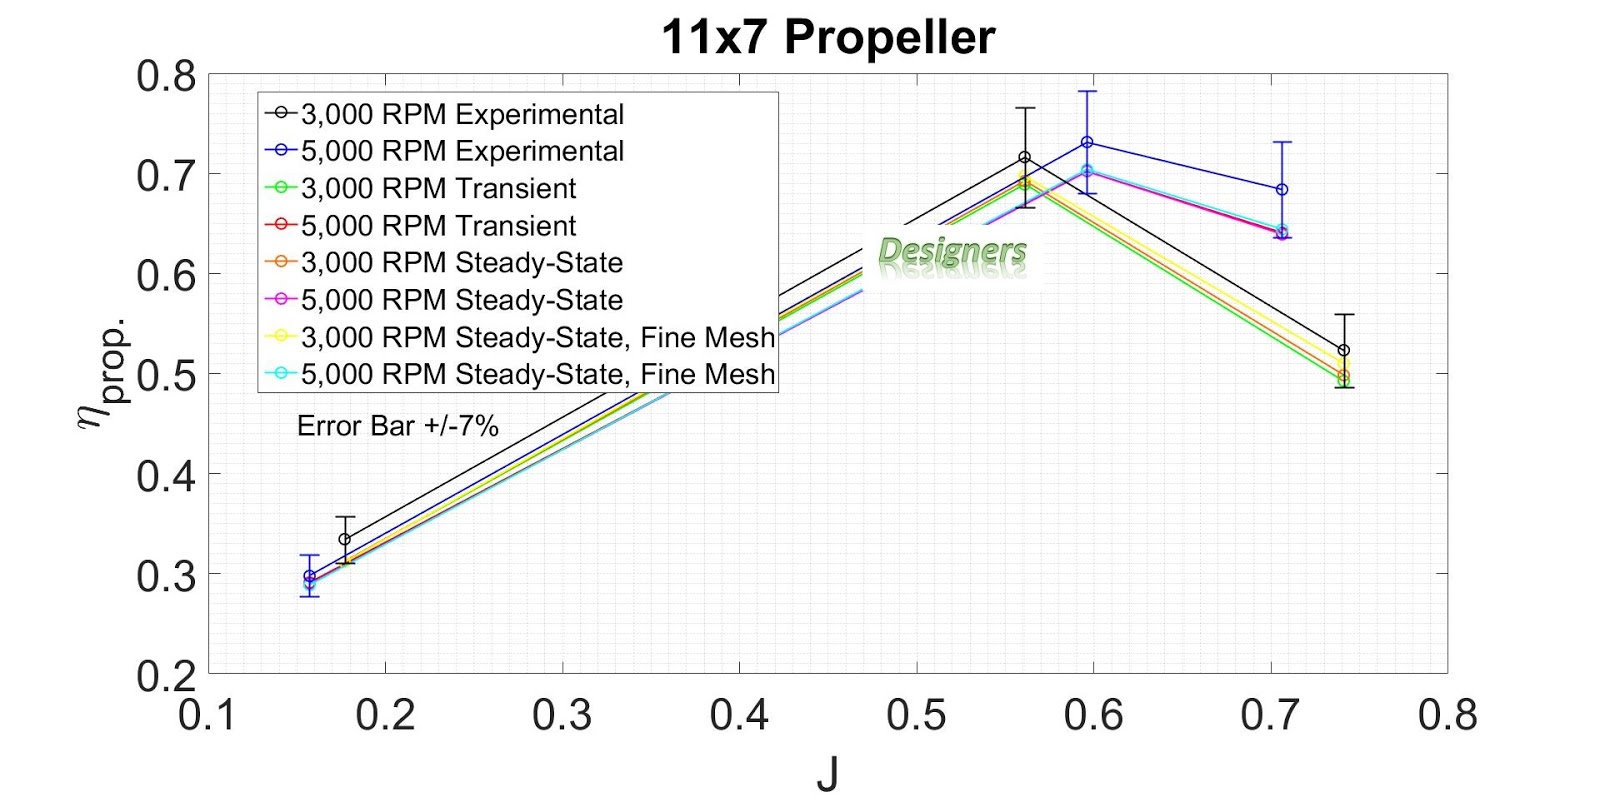
     As expected, the propeller efficiencies of transient and steady-state analysis are within 0.9% of each other, as shown in Fig. 1-2. Therefore, it is advised to simulate propellers and horizontal axis wind turbines using the steady-state technique as long as no time-dependent boundary conditions are employed.
 
Fig. 1, Propeller efficiency plot.
  
 Fig. 2, Propeller efficiency plot.
 
     It can be seen from Fig. 3-4 that time taken by the steady-state simulation to converge is on average 42.37% less that the transient analysis.  The steady-state analysis takes considerably less time to give a solution then a transient analysis.
 
Fig. 3, Solution time.
 
Fig. 4, Solution time.
 
Thank you for reading. If you would like to collaborate on research projects, please reach out.

Monday 23 July 2018

11x7 Aeronautic Propeller Characteristics (Using CFD) (Verified and Validated) (Update 02)

     This post presents the results from an aeronautic propeller CFD analysis.
    
     An 11x7 propeller was modelled using SolidWorks CAD package using the geometry from [1]. The simulations were run at two different rotational velocities and each rotational velocity was simulated at three advance ratios. The mesh for the 3,000 RPM rotational velocity had 213,205 total cells among which 24,048 cells were at the solid fluid boundary. While, the mesh for the 5,000 RPM rotational velocity had 369,963 total cells among which 68,594 cells were at the solid fluid boundary. A mesh control was employed to refine the mesh near the propeller geometry and at the boundary of the rotating region and the stationery domain for all of the cases simulated. This was done to ensure accuracy of the results was within an acceptable range. The results of the numerical simulations are plotted along with the experimental results [1] in Fig. 1.


Fig. 1 J= Advance Ratio, ηprop = propeller efficiency

     It can be seen from Fig. 1 that the trends for the propeller efficiency are in agreement with the experimental results. To increase the mesh density for the mesh independence test, the number of cells in  each of the respective co-ordinate directions was increased by a factor of 1.1. The mesh is shown in the Fig. 2.

Fig. 2 The computational mesh around the propeller.

     The computational domain size was at 2D x 2D x 2.4D, D being the propeller diameter, as shown in Fig. 3. In Fig. 3, the curved teal arrow represents the direction of rotation of the sliding mesh. The blue arrow represents the direction of free stream velocity while the brown arrow represents the force of gravity.

 Fig. 3 The computational domain.


Fig. 4 The pressure distribution and the velocity vectors around the propeller.

     The CAD model files and the simulation setup files for the numerical analysis are available here.

     Thank you for reading. If you'd like to collaborate on research projects, please reach out.

[1] Brandt, J. B., & Selig, M. S., “Propeller Performance Data at Low Reynolds Numbers,” 49th AIAA Aerospace Sciences Meeting, AIAA Paper 2011-1255, Orlando, FL, 2011.
doi.org/10.2514/6.2011-1255
 

Update 01

     Results from the mesh independent study are now available.

Update 02

     CAD model files are now uploaded. The CFD simulation setup files are also included.

Sunday 22 July 2018

11x4.7 Aeronautic Propeller Characteristics (Using CFD) (Verified and Validated) (Update 02)

     This post presents the results from an aeronautic propeller CFD analysis.

     An 11x4.7 propeller was modelled using SolidWorks CAD package using the geometry from [1]. The simulations were run at two different rotational velocities and each rotational velocity was simulated at three advance ratios. The mesh for the 3,000 RPM rotational velocity had 206,184 total cells among which 22,103 cells were at the solid fluid boundary. While, the mesh for the 6,000 RPM rotational velocity had 357,300 total cells among which 64,012 cells were at the solid fluid boundary. A mesh control was employed to refine the mesh near the propeller geometry and at the boundary of the rotating region and the stationery domain for all of the cases simulated. This was done to ensure accuracy of the results was within an acceptable range. The results of the numerical simulations are plotted along with the experimental results [1] in Fig. 1.


Fig. 1 J= Advance Ratio, ηprop = propeller efficiency
 
     It can be seen from Fig. 1 that the trends for the propeller efficiency are in agreement with the experimental results. The fine mesh had the number of cells in each of the respective co-ordinate directions increased by a factor of 1.1. The mesh is shown in the Fig. 2.
 
Fig. 2 The computational mesh around the propeller.
 
     The computational domain size was at 2D x 2D x 2.4D, D being the propeller diameter, as shown in Fig. 3. In Fig. 3, the curved teal arrow represents the direction of rotation of the sliding mesh. The blue arrow represents the direction of free stream velocity while the brown arrow represents the force of gravity.

Fig. 3 The computational domain.

Fig. 4 The pressure distribution and the velocity vectors around the propeller.

     The CAD model and numerical simulation setup files are available here.
 
     Thank you for reading. If you'd like to collaborate on research projects, please reach out.

     [1] Brandt, J. B., & Selig, M. S., “Propeller Performance Data at Low Reynolds Numbers,” 49th AIAA Aerospace Sciences Meeting, AIAA Paper 2011-1255, Orlando, FL, 2011.
doi.org/10.2514/6.2011-1255
 

Update 01

     Mesh independent test results are now available.
 

Update 02

     CAD files for the propeller including the CFD analysis setup are now available.