Showing posts with label airfoil. Show all posts

Saturday 8 August 2020

The Aerofoil

     Aerofoil, a simple geometric shape that is responsible for heavier than air flight and energy generation from of wind, hydraulic and steam turbines. However, much mystery and confusion exists about how the aerofoil works. Here an explanation is presented about the working of an aerofoil by using computational fluid dynamics and without using any equations.

     The fluid bends and tends to follow the shape of an object placed in its path when the fluid flows around the said object such as an aerofoil. This phenomenon happens due to the Coanda effect. Fig. 1 shows streamlines around an aerofoil at a Mach number of 0.22 and Reynolds number of 5e6. It can be seen from Fig.1 that the fluid starts to bend as soon as it reaches the leading edge of the aerofoil and the fluid follows the shape of the aerofoil.


Fig. 1, The white arrows represent the direction of fluid flow.

     It is well understood that, as a moving fluid bends (changes direction), a pressure difference is created across the flow path. To understand this better, consider a tornado or a typhoon (not the aircrafts). In a tornado, the fluid revolves around a central axis. Consider a point at the center of the tornado. As this point moves towards the circumference of the tornado i.e. away from the center, the pressure increases and vice-versa. This happens due to the curvature of the streamlines inside a tornado. The more the curvature difference, the more the pressure difference across the streamlines.

     In the case of symmetric aerofoils (which have top and bottom half at the same shape), there is no lift generated because the curvature of the streamlines is same on both the suction (top) and pressure (bottom) sides of the aerofoil. The resulting pressure difference between the suction and the pressure sides is zero. This can be seen in the negative coefficient of pressure (-Cp) plot shown in Fig. 2. The coefficient of pressures can be seen to overlap. This plot and subsequent figures and plots are generated using the data obtained from the computational fluid dynamics analysis of the aerofoil. Fig. 3 shows pressure distribution around the aerofoil. It is quite clear that the pressures at the top and bottom surface of the aerofoil are same, hence no lift generation. It is also evident that a pressure difference exists between leading and trailing edge of the aerofoil, hence the presence of the drag force (pressure drag) even at no angle of attack.


Fig. 2, Along the horizontal axis, 0 refers to leading edge.


Fig. 3, Air flow is from left to right.

     But, if the same aerofoil is placed at an angle to the flow, the curvature of the streamlines change, as visible in Fig. 4. Due to the different curvature on the suction and pressure side of the aerofoil, a pressure gradient in created between the suction and pressure side of the aerofoil with lower pressure at the top and higher pressure at the bottom, as shown in Figs. 5. The -Cp plots for the aerofoil at the angle of attack is shown in Fig. 5. The pressure difference is quite clear in both Figs. 5-6.


Fig. 4, The white arrows represent direction of fluid flow.


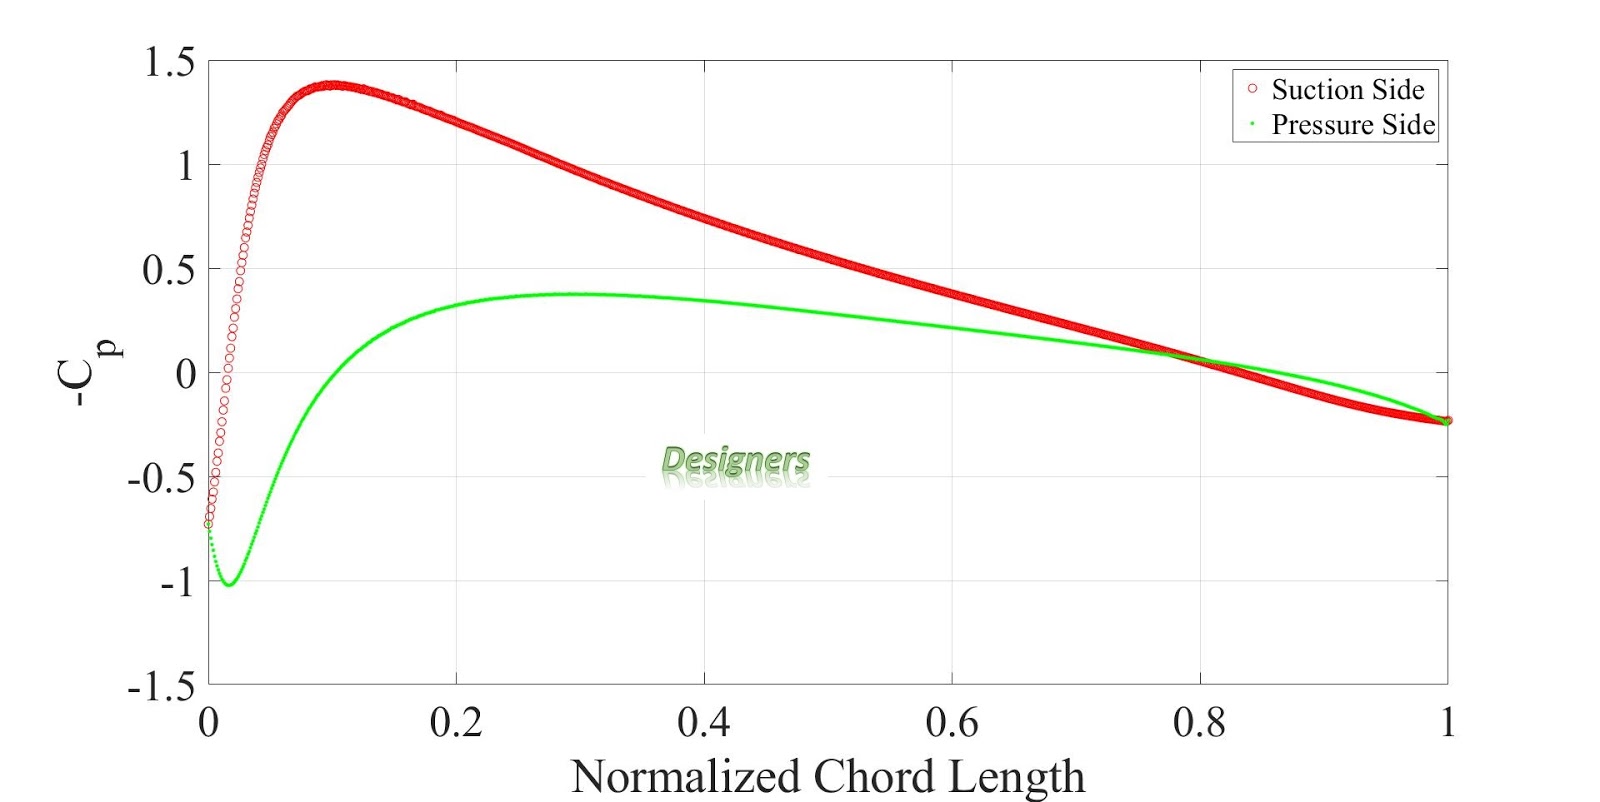
Fig. 5, Along the horizontal axis, 0 refers to leading edge.


Fig. 6, Air flow is from left to right.

     In the far field, the pressure is uniform, colored by green in Figs. 3, 6. In a case when the fluid is turning, the pressure increases as away from the center of the curvature and vice versa. Looking at the suction side, the pressure will decrease as distance to the center increases. The pressure gradient at the bottom can be explained by the same reason. This difference in pressure is what causes the lift force, as evident from Fig. 5.

     Velocity distribution around the aerofoil at an angle of attack is shown in Fig. 7. It can be seen that the fluid has more velocity at the suction side of the aerofoil as compared to the pressure side. The velocity distribution on the aerofoil without an angle of attack is same on both the pressure and suction sides of the aerofoil and is shown in Fig. 8.

Fig. 7, Air flow is from left to right.


Fig. 8, Air flow is from left to right.
     
     This again, can be explained by the pressure gradient. It can be seen from Figs. 5-6 that the pressure gradient at the suction side of the aerofoil is much more favorable as compared to the pressure side. It can be seen from Figs. 5-6 that the pressure is highest at the leading edge of the aerofoil (stagnation point). The pressure falls to its lowest magnitude past the leading edge of the aerofoil on the suction side. Meanwhile, on the pressure side, the pressure drop is less severe as compared to the suction side. As a result, the fluid faces less resistance on suction side of the aerofoil in comparison with the pressure side. This is the reason why fluid velocity is more at the top as compared to the bottom of the aerofoil, not vice versa. In all the figures, the color red means maximum magnitude and the color blue implies minimum magnitude.

If you want to collaborate on the research projects related to turbomachinery, aerodynamics, renewable energy, please reach out. Thank you very much for reading.

Wednesday 15 July 2020

Aerofoil Kinematics Computational Fluid Dynamics (Update: 01)

This post is about a 2D NACA 0010 aerofoil undergoing various forms of forced kinematics i.e. pure heaving and pitching and a combination of two known as flapping.

Heaving motion is achieved by changing the angle of attack on the aerofoil based on the Eqn. 1.

αe = arctan[2*π*Sta*cos(2*π*fh*t)] + αi               Eqn. 1

The pitching motion is achieved by employing the sliding mesh with the rotational velocity governed by Eqn. 2.

ω = 2*π*fh*ϑ*cos(2*π*fh*t)                                 Eqn. 2

w.r.t. Eqn. 1-2 αe is the effective angle of attack, Sta is Strouhal number (defined as (fh*h0/U∞)), fh is the frequency of oscillations, while ωt and ϑ represent rotational velocity, instantaneous time and pitching angle. h0 is the heaving amplitude and U∞ is the free stream velocity.

The flapping motion is achieved by a combination of the heaving and pitching. In this particular simulation, the aerofoil is in the power extraction mode, meaning the feathering parameter χ is greater in magnitude than 1.0. Feathering parameter is defined by Eqn. 3.

χ = ϑ/arctan(h0*2*π*fh/U∞)                                  Eqn. 3

The boundary conditions employed for the set of simulations are at Re 50,000, Sta 0.0149, h= aerofoil chord lengthχ = 1.1 and fh = 0.5 Hz. The animation of the velocity contours superimposed with streamlines is shown in Fig. 1. The velocity scale ranges from 0 to 7 m/s. Pressure distribution around the aerofoils in various forms of motion, after five complete cycles is shown in Fig. 2.


Fig. 1, Flow animation, fluid flow direction is from left to right


Fig. 2, Fluid flow is from left to right

If you want to collaborate on the research projects related to turbomachinery, aerodynamics, renewable energy, please reach out. Thank you very much for reading.

Sunday 5 July 2015

Canal Turbine Concept


It's a concept I am currently working on, so far I gave made a CAD model (renderings attached) of it in SolidWorks and analyzed it using its built in CFD module.

There are many advantages of canal turbines over wind turbines, prominent one's being:


Unidirectional flow


Water flows in one direction in a canal so we don't need pitch and yaw control surfaces. That simplifies the design process and reduces weight.

Constant flow rate


We (humans) control water flow rate through canals and it's almost same all year, so we don't have to worry about blade aero foil design to suit variable/abruptly variable flow rate, that makes design process further straight forward.

Large Electricity potential


Canals are 100s of km long, imagine the electricity potential in the canals. You can put these turbines in irrigation canals and it'll power nearby villages and all the irrigation equipment etc.

Higher Power/Discharge Ratio


Water is ~816 times dense (powerful) than air, so for the same discharge (flow) rate we get potentially 816 times more power. Which means more we can make designs that are lighter, smaller and easier to manage and maintain.

Easy maintenance


Fitted less than ~1 m deep inside the canal and can be retracted for maintenance at ground level, making maintenance very easy or better yet, we can maintain them while canals are being cleaned.


Plots for Comparison between Lift and Drag Produced by a Legacy Wing VS a Wing with Tubercles (Humpback Whale Fin's Inspired)

Comparison between Lift and Drag Produced by a Legacy Wing VS a Wing with Tubercles (Humpback Whale Fin's Inspired)

* Link for Plots (now showing here for some reason) http://3dimensionaldesigningandmanufacturing.blogspot.com/2015/07/plots-for-comparison-between-lift-and.html

Following data was obtained from the CFD Simulations carried out in SolidWorks Flow Simulation Premium.

Project: Design of a Wing/Blade with Tubercles for Airplanes and/or Turbines


Without Tubercles

Air Speed in Km/h

Lift in N

Drag in N

150
46.307
14.775
140
39.942
12.917
130
33.432
11.057
                         120
28.807
9.498
110
24.234
7.928
100
20.593
6.625
90
15.836
5.352
80
12.482
4.205
70
9.411
3.243
60
7.272
2.406
50
4.873
1.680
40
3.130
1.082
30
1.763
0.612
20
0.810
0.279
10
0.231
0.072


With Tubercles

Air Speed in Km/h

Lift in N

Drag in N

150
50.616
11.360
140
48.131
10.008
130
37.190
8.505
120
30.988
7.309
110
24.784
6.079
100
20.892
5.094
90
17.225
4.146
80
13.412
3.287
70
9.955
2.507
60
7.444
1.849
50
4.955
1.286
40
2.991
0.828
30
1.652
0.468
20
0.725
0.212
10
0.214
0.057


Comparison between Lift and Drag


Air Speed in Km/h
Percentage Less Drag
Percentage More Lift
150
23.113
 
8.513
140
22.520
 
17.014
130
23.080
 
10.105
120
22.974
7.038
110
23.322
2.219
100
23.109
1.431
90
22.534
8.064
80
21.831
6.934
70
22.695
5.465
60
23.150
2.311
50
23.452
1.655
40
23.475
-7.523
30
23.529
-6.719
20
24.014
-11.72
10
20.833
-7.94


It is clear that the wing with tubercles not only produces more lift at a particular velocity but also less drag.

Data for the Wing without Tubercles:


Wing Span: 1.07 m

Chord Length: 0.229 m

Air Velocity: 0-150 Km/h head on

Vertical Pitch: 0 Degree

Gravity Considered

Fluid: Dry Air at STP

Mesh Settings: Coarse (3/8)


Data for the Wing with Tubercles:


Wing Span: 1.067 m

Chord Length Large: 0.229 m

Chord Length Small: 0.203 m

Air Velocity: 0-150 Km/h head on

Vertical Pitch: 0 Degree

Gravity Considered

Fluid: Dry Air at STP

Mesh Settings: Coarse (3/8)


Let's now take a look at visual representation of data.


This Plot Shows Air Velocity VS Drag, Lift by the Wing without Tubercles


This Plot Shows Air Velocity VS Drag, Lift by the Wing with Tubercles

As you can see from above two plots; the wing with tubercles generates more lift and less drag.


This Plot Shows Air Velocity VS Lift Generated by the Wings

The green line represents the Lift generated by the wing with tubercles. It is between two to six percent more at each velocity.


This Plot Shows Air Velocity VS Drag Generated by the Wings

The green line represents the Drag generated by the wing with tubercles. It is around twenty two percent less at each velocity.


This Plot Shows Air velocity VS Lift to Drag Ratio

It is clear from this plot that Lift to Drag ratio of the wing with tubercles is around thirty three percent more for the wing without tubercles at a velocity point.


This Plot Shows Air Flow around the Wings at 150 Km/h from the Right Side


This Plot Shows Air Flow around the Wings at 150 Km/h

The Need for Tubercles


In aviation there are four forces at play, Lift which over comes Weight and Thrust which overcomes Drag. For a cruise speed at a particular altitude, three of these forces are almost constant. Our goal is to minimize Thrust, Drag and Weight and maximize Lift, this is because Thrust costs in terms of fuel flow rate and Weight and Drag negatively impacts on the agility of the aircraft. Aerodynamically efficient Wings and/or Blades with "Tubercles" will not only increase Lift and but also decrease Drag. This all means that we will need less Thrust for a cruise speed than before, that results in savings in terms of fuel which will result in healthier environment.


Applications:


Canal Turbine Concept


It's a concept I am currently working on, so far I gave made a CAD model (renderings attached) of it in SolidWorks and analyzed it using its built in CFD module.

There are many advantages of canal turbines over wind turbines, prominent one's being:


Unidirectional flow


Water flows in one direction in a canal so we don't need pitch and yaw control surfaces. That simplifies the design process and reduces weight.

Constant flow rate


We (humans) control water flow rate through canals and it's almost same all year, so we don't have to worry about blade aero foil design to suit variable/abruptly variable flow rate, that makes design process further straight forward.

Large Electricity potential


Canals are 100s of km long, imagine the electricity potential in the canals. You can put these turbines in irrigation canals and it'll power nearby villages and all the irrigation equipment etc.

Higher Power/Discharge Ratio


Water is ~816 times dense (powerful) than air, so for the same discharge (flow) rate we get potentially 816 times more power. Which means more we can make designs that are lighter, smaller and easier to manage and maintain.

Easy maintenance


Fitted less than ~1 m deep inside the canal and can be retracted for maintenance at ground level, making maintenance very easy or better yet, we can maintain them while canals are being cleaned.