Monday, 17 April 2023

Executive transport aircraft with truss-braced wing (World's First)

     To explore large-er aspect ratio wings; one fine morning, I just thought it would be fun to put a truss-braced wing in a Piaggio P.180 "Avanti". The modified design CAD files are is available here. A comparison is shown in Fig. 1. I am too lazy to make 2 separate airplanes so I modified half of it so I can run a CFD analysis using one model and one mesh 🤣. A slight modification about which I will write later is the positioning of the flaps and ailerons. These are moved to the truss part from the main wing in the original design. The aspect ratio is of the truss-braced section is double the original. With a foldable wing, storage shouldn't be a problem?


Fig. 1, Row 1, L-R Top, bottom; Row 2, L-R front, back; Row 3 L-R, left, right views

     Cruise conditions are taken from [1] i.e. ~12,500 m and ~163.6 m/s. The CFD mesh has 4,892,425 cells out of those, 449,732 are the the surface of the jet. I compare lift/drag of both halves. The modified section produces 36.15% more drag (force) as compared to the original design. The modified section however, produces 49% more lift (force) than the original design. L/D for truss-winged section is at 6.72 as compared to 6.14 for the original design. In terms of L/D, the truss-braced wing section produced 🥁 ... 9.45% more Lift/Drag. A resounding success 😁, I'd say. For validation of CFD, read this and this.

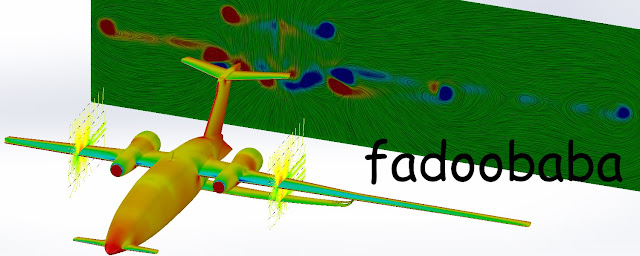
     Some post processing I did, is shown in Fig. 2. Velocity iso-lines with vectors are shown around the wings. Vorticity is shown in the wake of the jet(s). Tip vortex is smaller and less intense behind the truss-braced wing portion but there is another vortex where the truss meets with the main wing. In the main wing, for the trussed-braced portion; on the pressure side; the high pressure zones extend for a longer portion of the span in the span-wise direction as compared to the original design. Same is true for low pressure zones on the suction side of the main wing. Some day I will write a nice little paper and sent it to an AIAA conference, till then 𝌗.


Fig. 2, Colorful Fluid Dynamics 🌈

     Stream-wise vorticity is shown in Fig. 3. It is clear from Fig. 3 that the vorticity is less intense on the side with truss-braced wing as compared to the original design. Fig. 3 is colored by stream-wise velocity. The aircraft appears blue due to no slip condition.

Fig. 3, Some more Colorful Fluid Dynamics (CFD) 🌈

     Thank you for reading, if you would like to hire me as your master's / PhD student / post-doc / collaborate on research projects, please reach out! 😌

References

[1] "Operations Planning Guide". Business & Commercial Aviation. Aviation Week. May 2016. [https://web.archive.org/web/20160815060134/http://www.sellajet.com/adpages/BCA-2016.pdf]

Saturday, 1 April 2023

Turbulent Fluid Structure Interaction (FSI) - Benchmark Case

     After weeks spent self-learning about this type of simulation and countless nights spent troubleshooting this complex problem, I am pleased to share results. 😇 This post is about the FSI analysis of the FSI-PfS-2a. A case designed by Dr. Breuer. The geometry is shown in Fig. 1. The geometry details are available in ref. [1]. The geometry is made in SolidWorks CAD package and then imported to ANSYS via .STEP file. FSI combines Computational Fluid Dynamics (CFD) and structural analysis, i.e. the Finite Element Method (FEM).

Fig. 1, The geometry

     A combination of ANSYS Fluent, Mechanical and System Coupling are used for the analysis. Fig. 2 shows post-processing animation from the simulation. The top left shows stress while the displacements of the material are shown in top right. Bottom left and right show fluid velocity and vorticity, respectively. The vorticity is plotted along the axis perpendicular to the both lift and drag forces. the image in the center of animation shows fluid pressure acting on the cylinder and plate. Stagnation pressure is observed to change with time.

Fig. 2, The animation

     The boundary conditions from Mechanical are shown in Fig. 3. The condition A refers to gravity at 9.8066 m/s2 while B refers to fixed-support condition applied to the edge touching the cylinder. Boundary condition C refers to the fluid-solid interface. It is at these regions forces and displacements are exchanged. The structural mesh has 180 elements and 1,156 nodes. It is to be noted that the fluid regions are not meshed in mechanical and vice-versa. Furthermore, the number of mesh elements is limited by the system memory. The steel and rubber portions are connected via 4 connections i.e. edge/edge and edge/face contacts. The unmarked regions within Fig. 3 (top) are made symmetric. The  steel and rubber are considered linear elastic. No external force is applied in mechanical so this case can also be called as a case of vortex-induced vibrations. The direct sparse FEM solver is used for the Structural-FSI simulation.

Fig. 3, The boundary conditions and mesh

     The CFD mesh is shown in Fig. 4. The mesh is created using sweep method. Refinements are applied in areas of interest, i.e. wake and around the structure, using bodies of influence. Moreover, inflation mesh for y+ of 7.55 is applied on the cylinder to properly capture the boundary layer. The FSI-CFD simulation is initialized with data from static transient analysis using k–ω SST DES turbulence model. The k–ω DES model is initialized using static steady-state k–ω SST model. The flow parameters include a velocity of 1.385 m/s [1] corresponding to a Reynolds number of 30,470. The mesh has 79,305 cells. The dynamic mesh is handled through remeshing and smoothing via the radial basis function. Water is taken as a fluid for this simulation, same as [1]. Symmetry is applied to the walls facing perpendicular to flow. Top and bottom walls of the structure are considered adiabatic and with no shear. The SIMPLE algorithm is used. 2nd order accurate discretization schemes are used.

Fig. 4, The computational domain and the mesh

     It should be noted that for this simulations only 20 mm section of the whole geometry is simulated. This is because of computational resources limitations. The simulations took ~12 hours to solve 0.268 s of physical time with 32 GB RAM and 6 core CPU. The mesh motion along with vorticity iso-surfaces are shown in Fig. 5.

Fig. 5, The mesh and vorticity animation

     Thank you for reading, if you would like to hire me as your PhD student / post-doc  / collaborate on projects, please reach out.

References

[1] A. Kalmbach and M. Breuer, "Experimental PIV/V3Vmeasurementsofvortex-induced fluid–structure interaction in turbulent flow—A new benchmark FSI-PfS-2a", Journal of Fluids and Structures, Vol. 42, pp 369–387, 2013